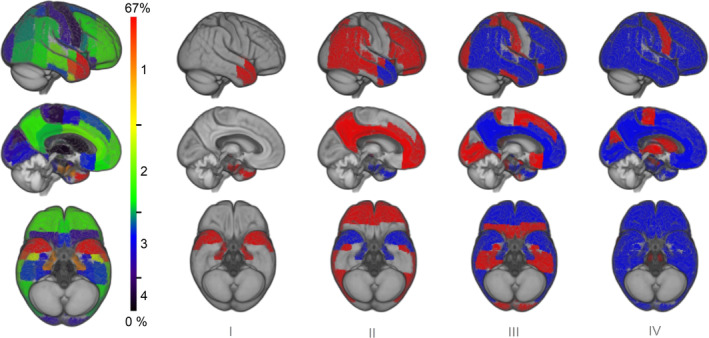
FIGURE 1.

Four‐stage model of regional amyloid progression. Brain renderings on the left illustrate the frequency of regional amyloid‐positivity across individuals on a color scale from black/blue (lowest) to yellow/red (highest). In the resulting four‐stage model of regional amyloid progression (I–IV), incremental stages are defined by involvement of higher numbered anatomic divisions (in red), in addition to the affected areas of the previous stage (blue)
