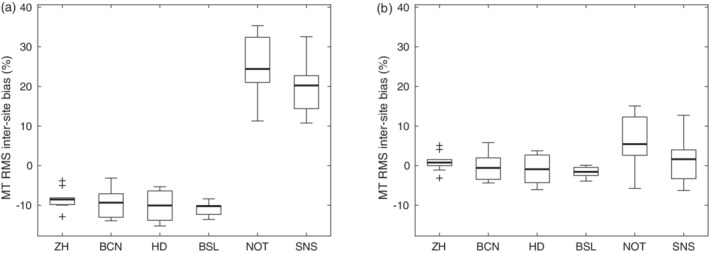
FIGURE 2.

Relative inter‐site bias of the MT values across subjects per site (a) without and (b) with rescaling of MT values. Box = interquartile range; bold horizontal line = median, feathers = data range of values across subjects. Cross = outlier, which exceeds the range of (q1–1.5 × [q3−q1]; q3 + 1.5 × [q3−q1]), where q1 and q3 are the 25th and 75th percentiles of the sample data, respectively
