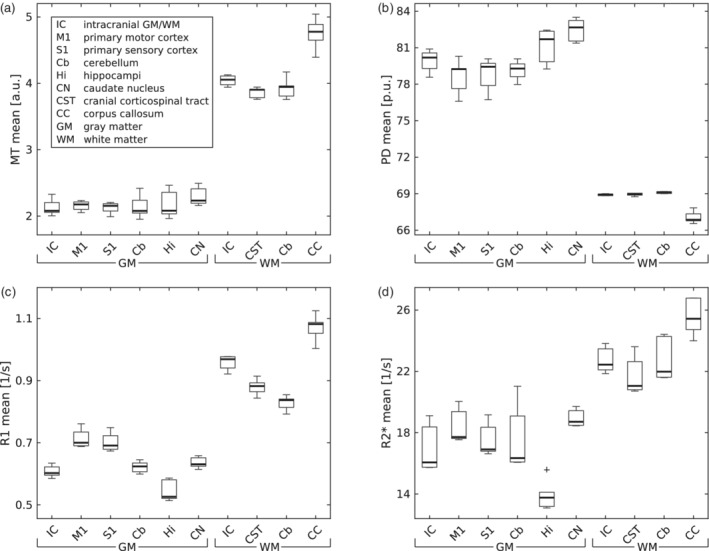
FIGURE 4.

Distribution of (a) MT, (b) PD, (c) R1, and (d) R2* mean values in regions of interest (ROI) across subjects and sites. Please note that PD values are scaled to 69 p.u. for the mean WM value by the PD map estimation process (Tabelow et al., 2019; Tofts, 2003). Box = interquartile range; bold horizontal line = median, feathers = data range of values across subjects. Cross = outlier, which exceeds the range of (q1–1.5 × [q3−q1]; q3 + 1.5 × [q3−q1]), where q1 and q3 are the 25th and 75th percentiles of the sample data, respectively
