FIGURE 6.

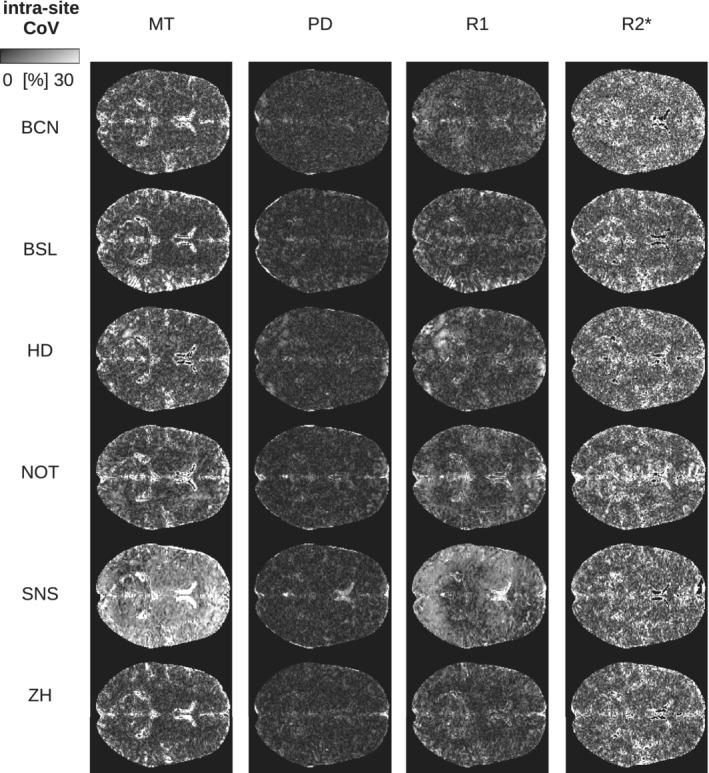
Intra‐site CoV of parameter maps shown for Subject 5 scanned at all sites (axial slice through the center of the brain). The intra‐site CoV was calculated across the scan and rescan measurements

Intra‐site CoV of parameter maps shown for Subject 5 scanned at all sites (axial slice through the center of the brain). The intra‐site CoV was calculated across the scan and rescan measurements