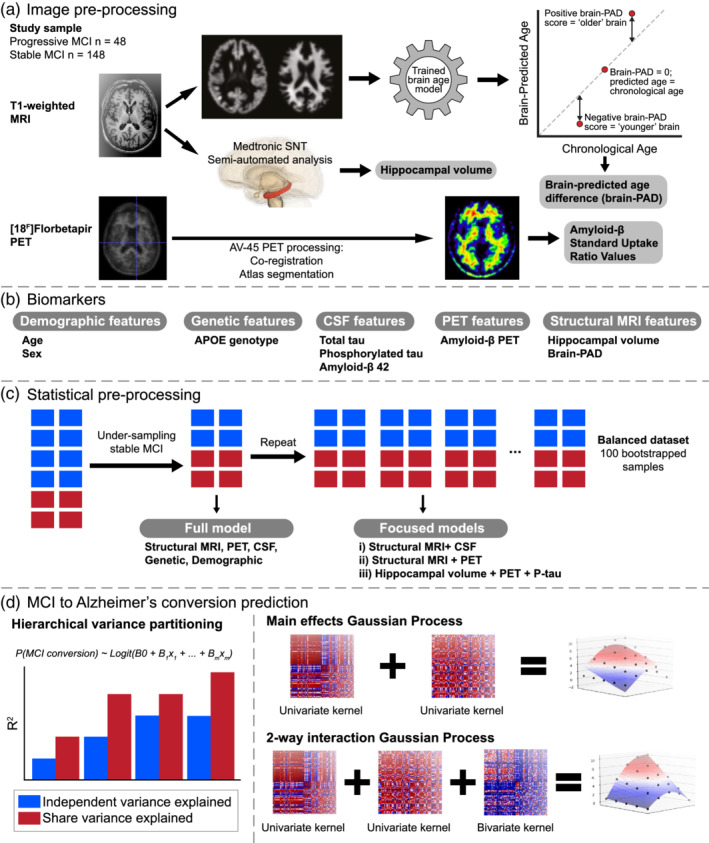
FIGURE 1.

Overview of study methods. (a) Raw T1‐weighted MRI scans are pre‐processed via the DARTEL pipeline in SPM12 to obtain grey matter and white matter volume maps. These are fed into a pretrained Gaussian Processes Regression based ‘brain‐age' prediction software to arrive at an estimation of Brain‐PAD, which is the difference between chronological age and neuroimaging‐predicted ‘brain‐age'. (b) CSF features and hippocampal volume alongside genetic and demographic information are also used as biomarkers; (c) Subsampling stable MCI to overcome the class imbalance. Repeated random subsampling of the stable MCI group 100 times for Gaussian Processes based models; (d) Partitioning of total variance explained into independent and shared variance explained for each biomarker; Gaussian Processes that allow just for main effects of biomarkers to be modelled are constructed by adding all the univariate squared exponential kernels corresponding to each biomarker. Full‐order interactions between all biomarkers considered are captured through a single multivariate squared exponential kernel; Full set of statistics (sensitivity, specificity, accuracy, AUC) are computed for each replicate. Paired t‐tests are conducted between accuracy scores stemming from main effects models and a model containing a multivariate kernel to assess if the increase in generalisation to unseen data are statistically significant
