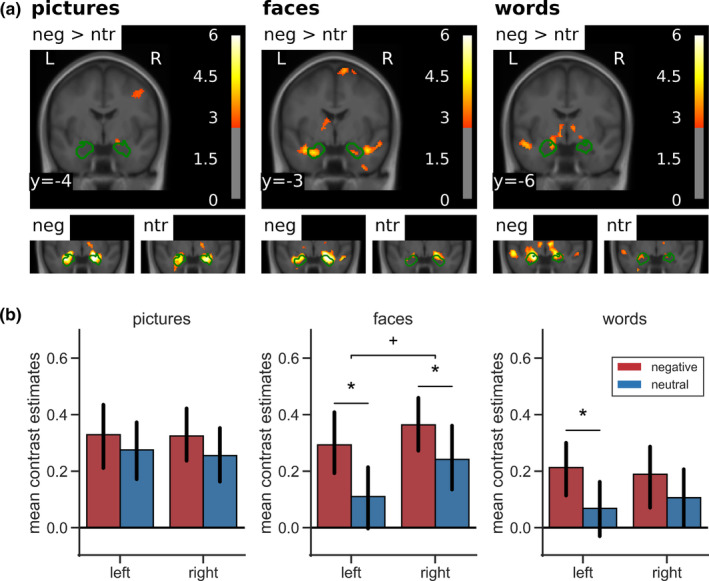
FIGURE 4.

Amygdala activation by negative versus neutral stimuli. (a) Top row: emotion effects in a coronal slice of the mean structural T1‐image of the participants including the amygdala in whole‐brain analyses thresholded at p < .005 (uncorrected) and a cluster‐forming threshold of k = 20. Green contours outline structural ROI for the analysis of lateralization of emotion effects in the amygdala. Bottom row: amygdala activation separately for negative and neutral stimuli against baseline in a coronal section zoomed in on the amygdala. (b) Mean contrast estimates in pre‐defined ROI. Error bars denote 95% confidence intervals. Asterisks indicate significance of post hoc tests: +p < .01; *p < .05. ROI, regions of interest
