
FIGURE C1.
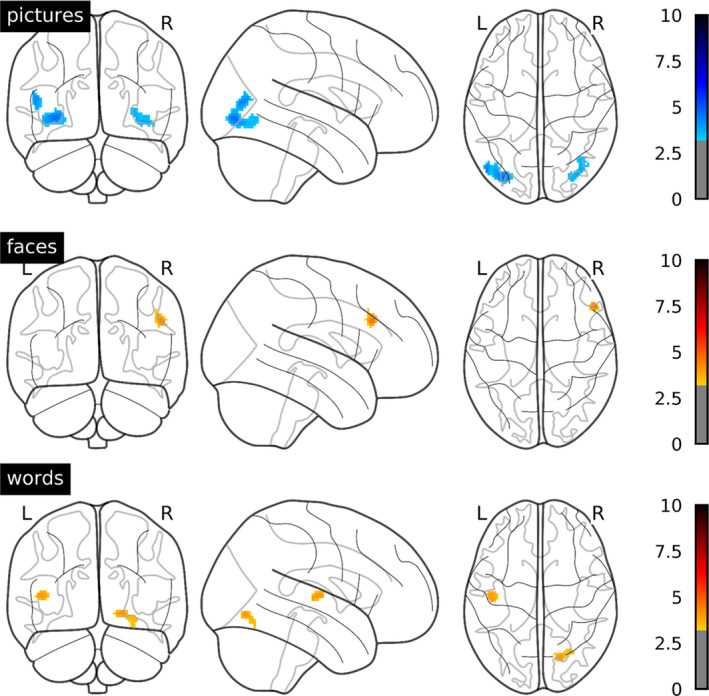
T values for the correlation of emotion effects and age thresholded at p < .001 uncorrected and a cluster‐forming threshold of k = 50 voxels within each stimulus type. Blue: negative correlation. Red: positive correlation
Official websites use .gov
A
.gov website belongs to an official
government organization in the United States.
Secure .gov websites use HTTPS
A lock (
) or https:// means you've safely
connected to the .gov website. Share sensitive
information only on official, secure websites.
T values for the correlation of emotion effects and age thresholded at p < .001 uncorrected and a cluster‐forming threshold of k = 50 voxels within each stimulus type. Blue: negative correlation. Red: positive correlation