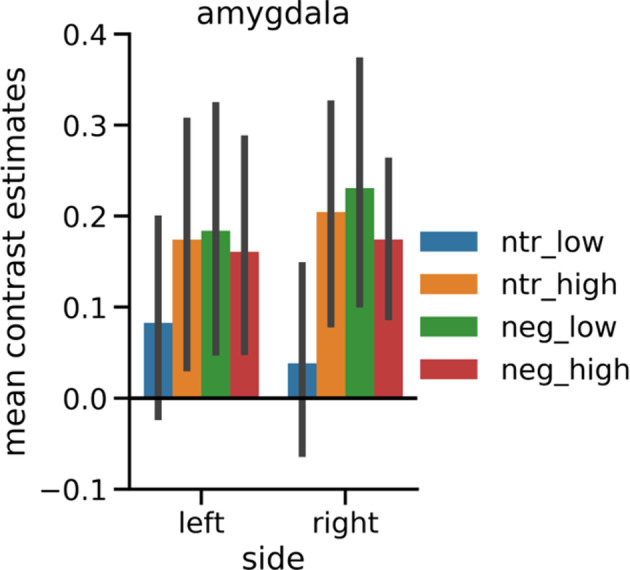
FIGURE D1.

Mean contrast estimates in the structural ROI of the amygdala for negative and neutral pictures split into higher and lower arousal subgroups. After exclusion of all pictures depicting animals, negative and neutral pictures were divided into halves each based on median split of the normative arousal ratings (Lang et al., 2008) and approximately matched the four subsets for social content. Normative arousal ratings of all subgroups differed significantly: neutral_low (arousal: M = 2.99, SE = 0.08): pictures 2,026, 2,038, 2,102, 2,384, 2,393, 2,396, 2,397, 2,411, 2,440, 2,495, 2,499, 2,513, 2,580, 2,840, 2,850, 5,471, 7,009, 7,187, 7,491, 7,513, 8,312; neutral_high (arousal: M = 4.01, SE = 0.09): pictures 2,308, 2,372, 2,377, 2,390, 2,400, 2,435, 2,484, 2,487, 2,525, 2,575, 2,579, 2,594, 2,635, 2,745, 2,749, 5,531, 7,476, 7,512, 7,550, 7,632, 8,241; negative_low (arousal: M = 5.08, SE = 0.10): pictures 2,095, 2,205, 2,276, 2,710, 3,051, 3,185, 3,230, 3,300, 3,301, 6,311, 9,000, 9,006, 9,007, 9,041, 9,043, 9,265, 9,402, 9,421, 9,432, 9,480, 9,584, 9,611; negative_high (arousal: M = 6.28, SE = 0.09): pictures 2,683, 2,811, 2,981, 3,103, 3,213, 3,550, 6,021, 6,313, 6,520, 6,821, 6,834, 7,380, 8,230, 8,485, 9,040, 9,433, 9,630, 9,800, 9,810, 9,909, 9,940. Error bars denote 95% confidence intervals
