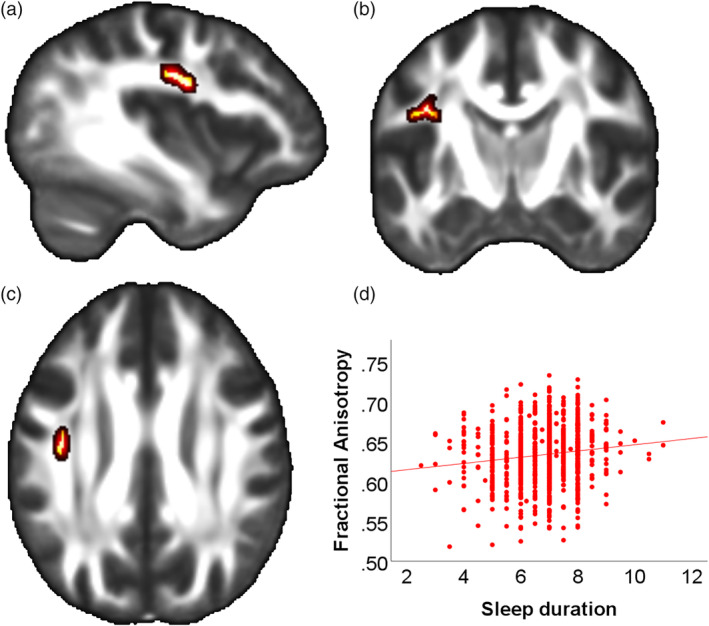
FIGURE 1.

Association of sleep duration and fractional anisotropy in the left superior longitudinal fasciscle. (a) Sagittal slice with x = −38 (MNI) of a mean FA map. Red‐yellow areas represent voxels (using FSL's “fill” command for better visualization), where a significant positive association between sleep duration and Fractional Anisotropy was detected (left superior longitudinal fascicle, pFWE < .05); (b) Coronal slice (y = −10) (c) Axial slice (z = 29); (d) Scatterplot showing the association sleep duration and extracted mean FA values from all significant voxels of the corresponding TBSS analysis
