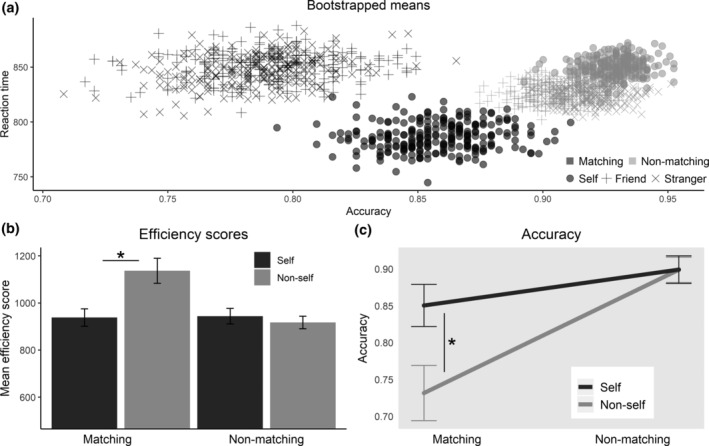
FIGURE 2.

Effect of self and matching without delays. Based only on trials without a delay. Asterisks indicate p < .05. (a) Bootstrapped mean values of accuracy and reaction time, using 250 samples per condition sampled with replacement. (b) Mean efficiency scores (reaction time divided by accuracy), bars indicate standard errors. (c) LogMM predictions of the probability that a response is correct. Bars represent standard errors of predictions
