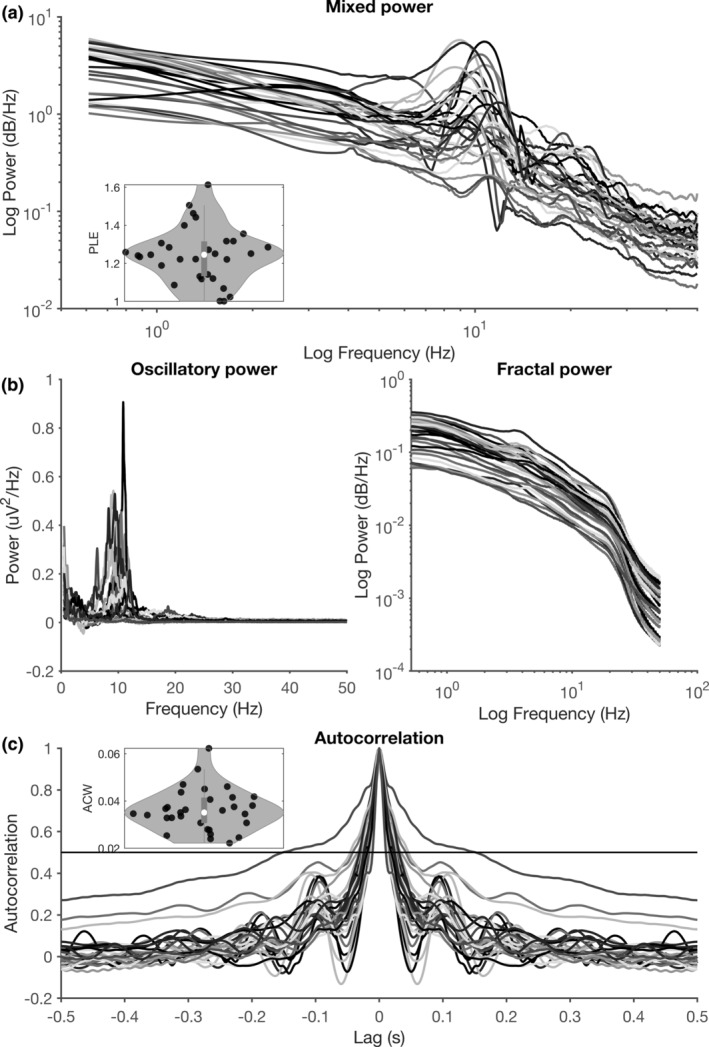
FIGURE 5.

Across‐subject variability in power spectra and autocorrelograms. (a) Resting‐state power spectra for each individual subject. The distribution of power‐law exponents is plotted in the inset. (b) IRASA decomposition of the power spectrum into oscillatory (left) and fractal (right) components. Oscillatory components are plotted on a linear scale (as no a priori logarithmic structure is present), while fractal components are plotted on a log–log scale. (c) Resting‐state autocorrelograms for each individual subject (each subject is a color). The threshold of 0.5 is plotted as a horizontal line, and the distribution of resulting autocorrelation windows (see Section 2) is plotted in the inset
