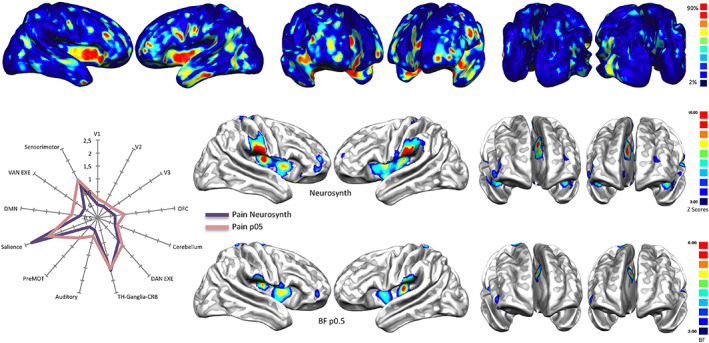
FIGURE 1.

Top: Base rates reports of how many pathologies of the VBM BrainMap database cause alterations in every area of the brain. Areas highlighted in red are those in which more than the 90% of pathologies cause at least an alteration. Middle and bottom: Association test (expressed in z points) over the term ‘Pain’ performed with Neurosynth and compared with a Bayes' factor (expressed in normalized BF values) map calculated with equiprobable priors over BrainMap data (see Table S6 for the specific numeric visualization). Left panel: Radar map illustrating the comparison between the network‐based decomposition of previous results expressed in z mean points (Neurosynth) and Bayes' factor values
