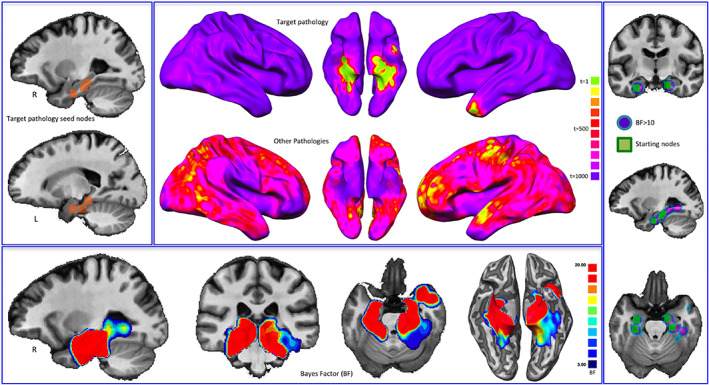
FIGURE 3.

Bayes' factor (BF) and the temporal evolution of pathologies. Top left: Starting nodes of the target pathology (Alzheimer's disease, AD). Middle: Temporal evolution (expressed in arbitrary time points) both of the target pathology and of all the other simulated pathologies. Colors from green to violet show the areas that are altered from early to late phases of the simulated pathological spread. Bottom: BF values calculated on synthetic data. Right panel: Comparison between the areas showing a BF > 10 and the starting points of the simulated target pathology
