
FIGURE 5.
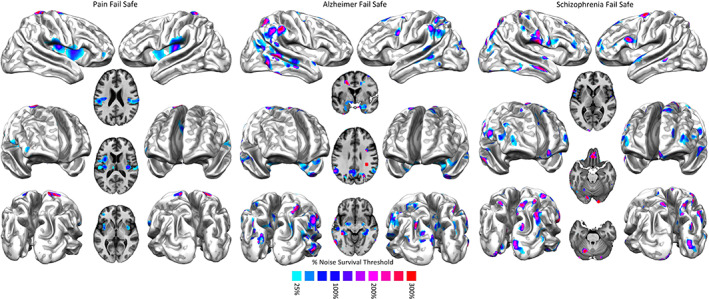
Left panel: Fail‐safe results of the Bayes' factor calculated over pain data. Areas colored from blue to red show increasing resistances to progressively greater injections of noise in the data set. Middle panel: Fail‐safe results of the Bayes' factor calculated over Alzheimer's disease data. Areas colored from blue to red show increasing resistances to progressively greater injections of noise in the data set. Right panel: Fail‐safe results of the Bayes' factor calculated over schizophrenia data. Areas colored from blue to red show increasing resistances to progressively greater injections of noise in the data set