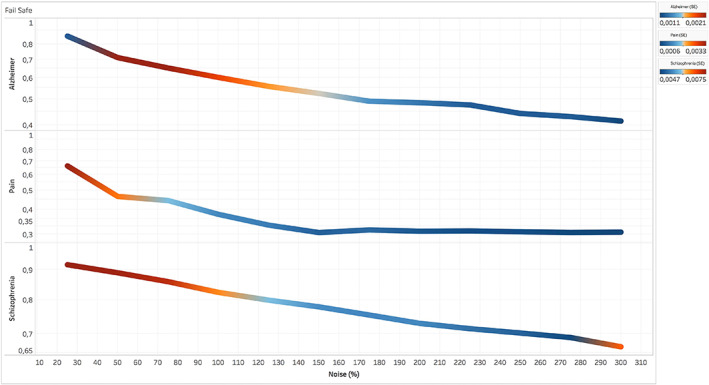
FIGURE 6.

Fail‐safe results of the Bayes' factor (BF) of three data sets (i.e., pain, Alzheimer's disease, and schizophrenia) obtained from the correlational values between the BF map calculated without injections of noise and BF maps calculated with progressively increasing injections of noise. Colors from blue to red indicate increasing values of standard deviation between the r values calculated in the different runs of the fail‐safe procedure
