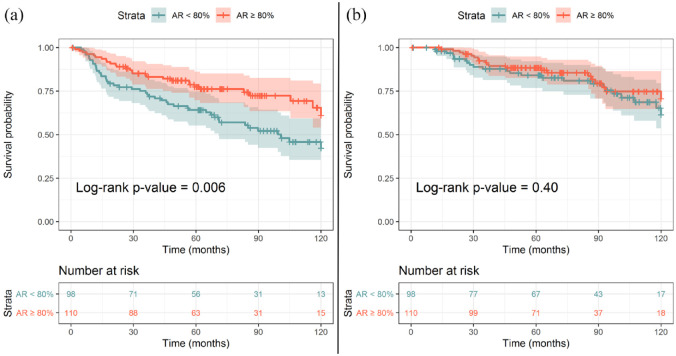
Figure 2.
Kaplan−Meier curve showing the relationship between androgen receptor expression and probability of relapse (A) and between androgen receptor expression and probability of survival (B). The numbers in each table describe the number of patients at risk by stratum at different time points. The shaded areas represent the 95% confidence interval of each curve. p-values were generated by the Log-rank test.
AR, androgen receptor.

