Figure 3.

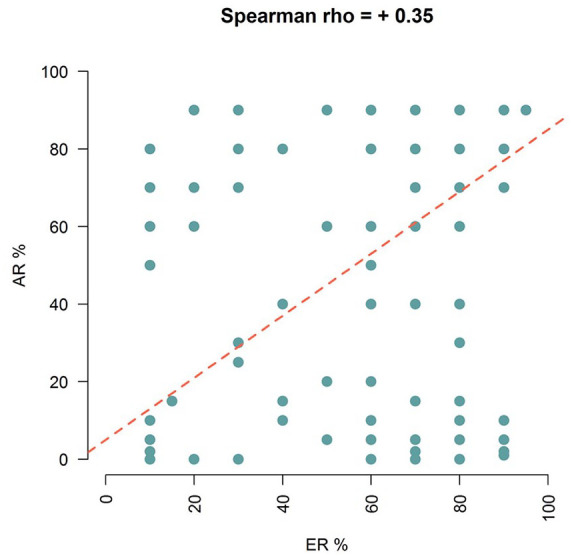
Scatterplot describing the correlation between estrogen receptor (ER) and androgen receptor (AR) expression. The quantile regression line is represented in red.

Scatterplot describing the correlation between estrogen receptor (ER) and androgen receptor (AR) expression. The quantile regression line is represented in red.