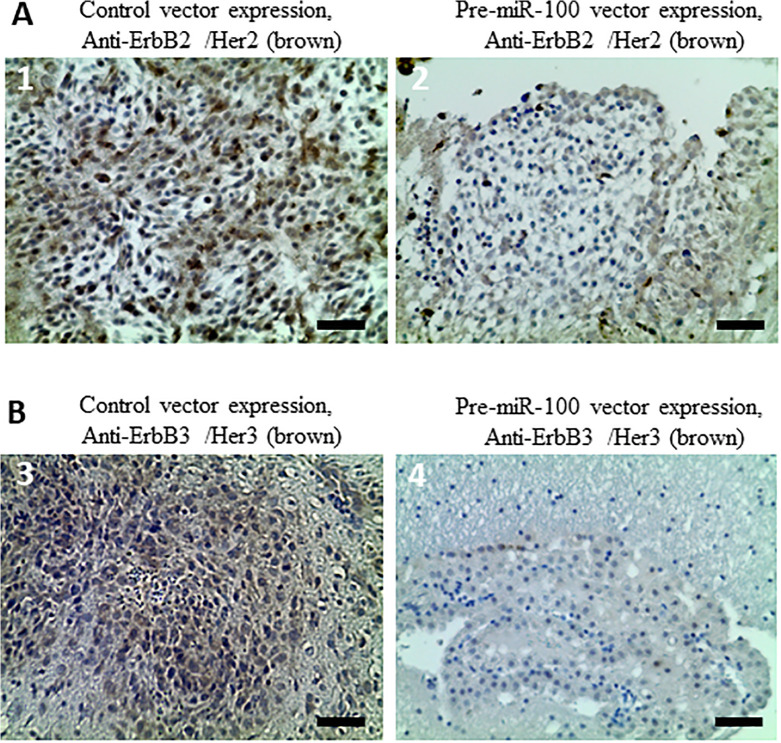
Figure 6.
Overexpression of pre-miR-100 decreases the expression of ErbB2 and ErbB3 in vivo. (A) Mouse NOD-SCID GBM xenografted brain tissue stably overexpressing pre-miR-100 exhibits less ErbB2 (Her2) expression than the control tissue overexpressing the vector alone. The darker the brown staining, the higher expression of Her2 antigen. The more positive stain is scored with more pluses. The pre-miR-100 group in picture 2, is scored with 1 plus (+), and the control tissue is scored with 3 pluses (+ + +) in picture 1. (B) GBM xenograft tissue stably overexpressing pre-miR-100 exhibits less ErbB3 (Her3) expression than control tissue overexpressing the vector alone. The pre-miR-100 group is scored with questionable positivity (+/-) in picture 4, and the control group is scored with 2 pluses (+ +) in picture 3. Scale bar: 50 µm.

