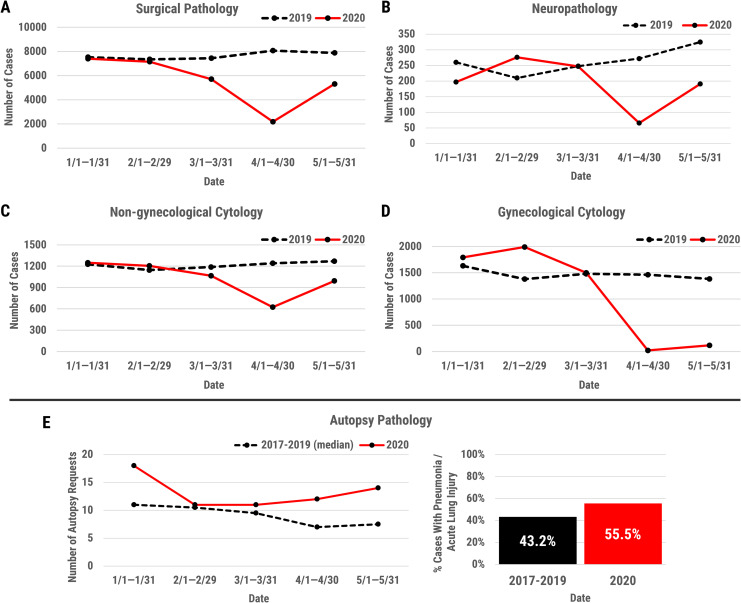
Figure 3.
Line graphs depicting the changes in surgical pathology (A), neuropathology (B), nongynecological cytology (C), gynecological cytology (D) case volumes with the onset of the coronavirus disease 2019 (COVID-19) pandemic, including the months of January through May 2020. Case volumes for each service from the same time period in 2019 are also shown. Autopsy cases during the months of January through May 2020 were compared to the median number of cases performed during the years 2017 to 2019 over the same period (E, left panel). The percent of pneumonia and/or acute lung injury (eg, acute, resolving diffuse alveolar damage) findings in autopsy cases performed from January to May 2020, compared to the median number of cases with these findings performed during the same period of the years 2017 to 2019 is shown (E, right panel). For each group, the percentage of cases with pneumonia or acute lung injury findings was determined based on all autopsies performed in that time frame with lung tissue available for examination. Cases with incidental and intravascular pathologies only (eg, small vessel thrombi), but no alveolar pathologies, were not included as positive findings. For January to May 2017 to 2019, the average percentage of positive cases is shown (43.2%), reflecting an expected rate of these pathologies at our institution in the pre-COVID-19 period. For January to May 2020, this rate was 54.2%, emphasizing the need for caution in autopsy performance, even with negative COVID-19 testing.

