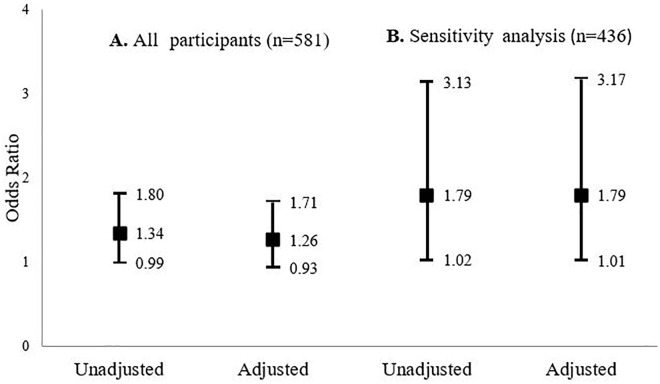
Figure 1.
ORs (95% confidence intervals) for the unadjusted and age- and BMI-adjusted binary logistic regression models regarding the associations between serum TAC and frailty for (A) the whole sample and (B) the sensitivity analysis, which excluded participants who were likely to have hyperuricemia. BMI = body mass index; TAC = total antioxidant capacity.

