
FIGURE 3.
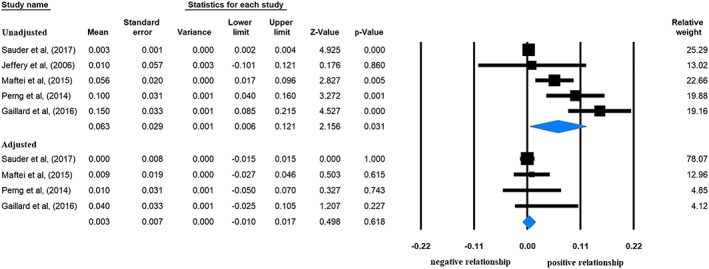
Beta regression coefficients describing the association between prepregnancy body mass index and offspring's Homeostatic Measurement Assessment for Insulin Resistance (HOMA‐IR) without (upper panel; heterogeneity: I 2 = 89.15%, p < 0.001) or with adjustment for offspring's anthropometry (lower panel; I 2 = 93.27%, p < 0.001). Black squares show beta values with the area reflecting the weight assigned to the individual studies. Horizontal bars indicate 95% confidence intervals. Diamonds show the overall point estimate with 95% confidence intervals