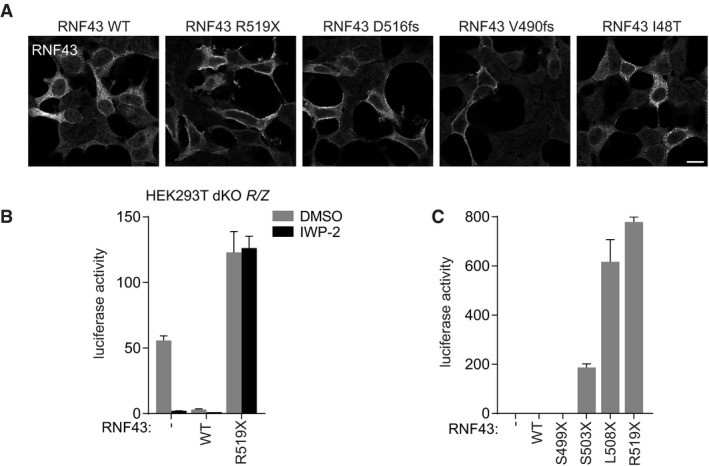
Figure EV1. Defining the region for oncogenic RNF43 truncations.

- RNF43 stainings of cells of the experiment shown in Fig 1E. Scale bar represents 10 μm.
- β‐catenin‐mediated reporter activity in HEK293T double knockout (dKO) RNF43/ZNRF3 (R/Z) cells expressing RNF43 WT and oncogenic RNF43 (R519X) after treatment with DMSO or the PORCN inhibitor IWP‐2 (5 μM; o/n). Average β‐catenin‐mediated reporter activities ± s.d. in n = 2 independent wells are shown.
- β‐catenin‐mediated reporter activity in HEK293T cells expressing the indicated RNF43 truncations in the absence of Wnt3a. Average β‐catenin‐mediated reporter activities ± s.d. in n = 2 independent wells are shown.
