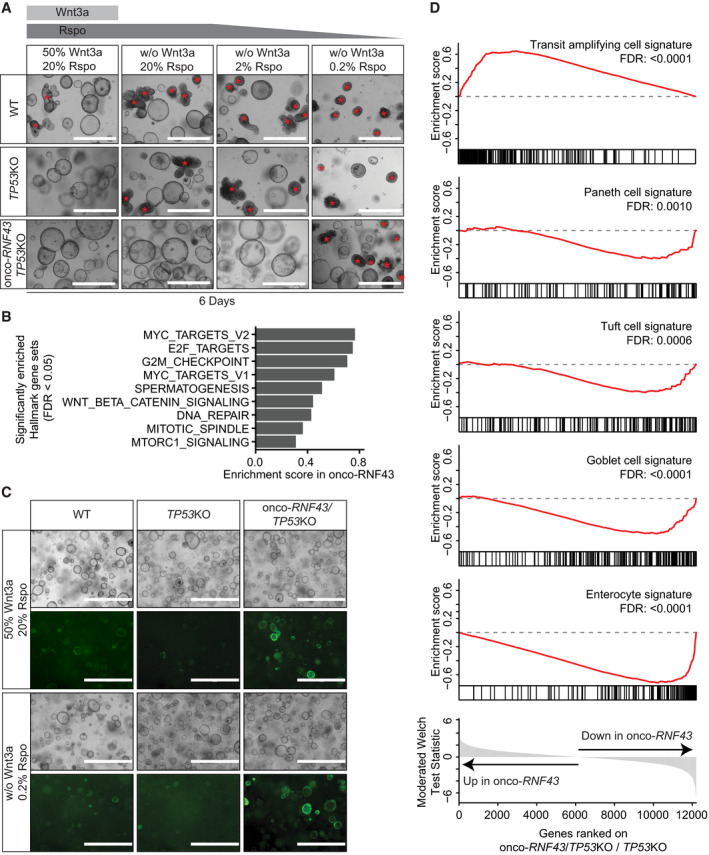
Figure 4. Onco‐RNF43/TP53 KO organoids display an oncogenic transcriptional profile that drives self‐renewal and niche‐independent growth.

- Bright‐field microscopy images of WT, TP53KO, and onco‐RNF43/TP53KO human colon organoid lines grown in medium with high Wnt/Rspo (20% conditioned medium (CM)) or without Wnt/Rspo (20, 2 or 0.2% CM). Images were taken 6 days after splitting. Scale bars represent 1,000 μm. Non‐cystic, non‐proliferative organoids are indicated with red asterisks.
- Bar plot showing the enrichment scores of significantly enriched MSigDB hallmark gene sets in onco‐RNF43/TP53KO compared to TP53KO organoids (FDR < 0.05).
- Bright‐field microscopy and fluorescence microscopy pictures of WT, TP53KO, and onco‐RNF43/TP53KO human colon organoid lines grown in two different media and transduced with the TOP‐GFP reporter. Images were taken 6 days after splitting. Scale bars represent 1,000 μm.
- Gene Set Enrichment Analysis of onco‐RNF43/TP53KO compared to TP53KO organoids in medium without Wnt/low Rspo (0.2%). Significantly changed intestinal cell‐type gene sets from Haber et al (2017) are shown (FDR < 0.05).
