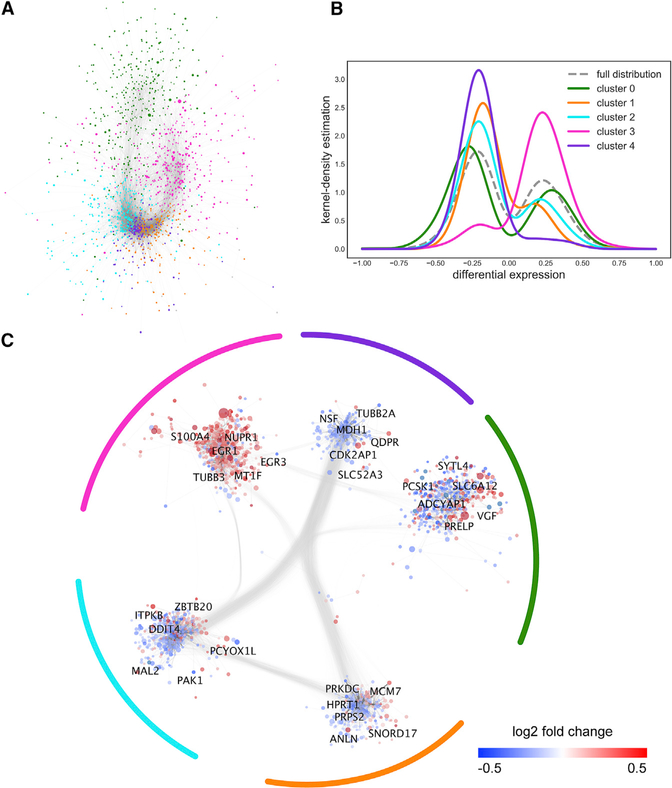
Figure 2. Composite Gene-Protein Interaction Network Reveals Significant Clustering in AD.
(A) AD subnetwork with cluster ID mapped to node color. The subnetwork is composed of genes differentially expressed in AD compared with NDCs and overlaid onto the GIANT brain-specific interactome. Node positions are fully determined from the spring layout. Clusters are determined using the Louvain modularity maximization algorithm.
(B) Distributions of log fold change values in each cluster, as well as in the entire AD subnetwork. Distribution curves were determined using a kernel-density estimation function (see also Figure S1).
(C) AD subnetwork with node positions biased by cluster membership. Node colors are mapped to the log fold change between AD and NDC. Node size represents the significance (FDR) of the gene’s differential expression in AD compared with NDC.

