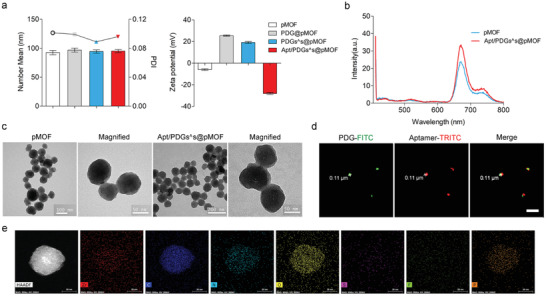
Figure 1.

Characterization of Apt/PDGs^s@pMOF formulations. a) Variation of DLS profile and Zeta potential in the lay‐by‐lay process of Apt/PDGs^s@pMOF preparation. b) Fluorescence emission spectrum excited at 405 nm of pMOF before and after capped with PDG and Aptamer. c) TEM images of pMOF and Apt/PDGs^s@pMOF. d) Co‐localization of PDG‐FITC and Aptamer‐TRITC under Leica TCS SP8 STED. ex/em (PDG‐FITC): 488 nm/520 nm. ex/em (Aptamer‐TRITC): 557 nm/576 nm. Scale bars: 1 µm. e) HAADF image and the distribution for the elemental mapping of Zr, C, N, O, S, F, P. Scale bars: 30 nm.
