
Figure 2.
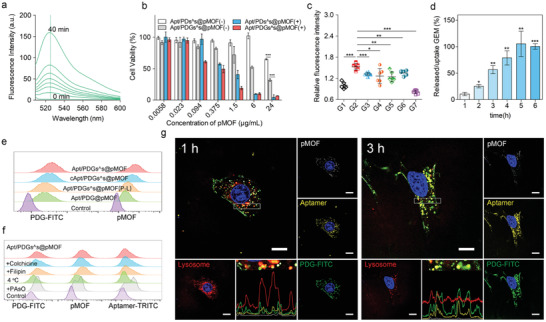
Investigation on PDT properties and cellular uptake of Apt/PDGs^s@pMOF. a) Florescence response of H2DCFH‐DA upon treatment with pMOF. Irradiation time from bottom to up was from 0 to 40 min. ex 485 nm. b) CCK‐8 assay of 4T1 cells after 48 h treatment with various concentrations of different formulations within (+) or without (−) irradiation. Data are presented as means ± SD (n = 4). c) Hydroxyl radical generation in 4T1 cells upon PDT treatment with different formulations. Data are presented as means ± SD (n = 6). d) Time‐dependent variation of intracellular PDG‐FITC uptake ratio and released/uptake ratio of GEM. Data are presented as means ± SD (n = 3). e) Cellular uptake of different formulations on 4T1 cells via flow cytometry analysis, based on the fluorescence signal of FITC‐labeled PDG and pMOF, respectively. f) Flow cytometry analysis of Apt/PDGs^s@pMOF's internalization mechanism, based on the fluorescence signal of FITC‐labeled PDG, TRITC‐labeled Aptamer and pMOF. g) Co‐localization of Apt/PDGs^s@pMOF and lysosome in 4T1 cells under CLSM after 1 h treatment, and a decreased co‐localization was found after 3 h treatment. Scale bars: 15 µm. G1: Control +L (laser irradiation), G2: Apt/PDGs^s@pMOF + L, G3: cApt/PDGs^s@pMOF + L, G4: Apt/PDG@pMOF + L, G5: Apt/PDGs^s@pMOF (P‐L, pre‐irradiated) + L, G6: Apt/PDGs^s@pMOF (+NAC) + L, G7: Apt/PDGs^s@pMOF + D (dark). Significance is defined as ns, no significance, * p < 0.05, ** p < 0.01, *** p < 0.001.