Figure 4.

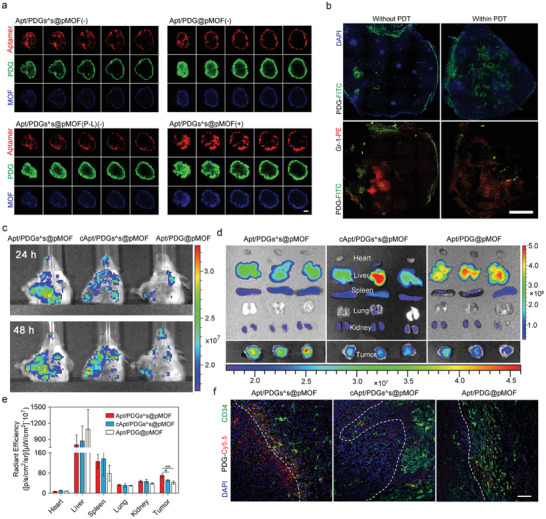
Evaluation of tumor targeting and penetration. a) Penetration efficiency of crosslinked Apt/PDGs^s@pMOF under several condition ((−): dark, (+): laser irradiation, (P‐L): pre‐irradiated) and non‐crosslinked Apt/PDG@pMOF into 4T1 tumor spheroids with 4 h of incubation and selective laser exposure for 5 min. The CLSM images were gained based on fluorescence signal of FITC‐labeled PDG, TRITC‐labeled Aptamer and pMOF. Scale bar: 75 µm. Z‐axis depth 20 µm. b) Penetration efficiency of FITC‐labeled PDG or Apt/PDGs^s@pMOF into tumor lesion in 4T1 tumor‐bearing mice with selective laser exposure for 10 min. Scale bar: 1 mm. c) In vivo images of tumor‐bearing mice intravenously administrated with Cy5.5‐labeled formulations at 24 and 48 h post the injection by IVIS. d) Ex vivo images of excised organs isolated from tumor‐bearing mice by IVIS at 48 h post the injection. e) Bio‐distribution of the Cy5.5‐labeled nanoparticles 48 h after intravenous injection into tumor‐bearing mice (n = 3). f) CD34‐staining and nanoparticle distribution in frozen tumor slices from tumor‐bearing mice at 48 h after administration with Cy5.5‐labeled nanoparticles. Scale bar: 75 µm. Significance is defined as ns, no significance, * p < 0.05, ** p < 0.01, *** p < 0.001.
