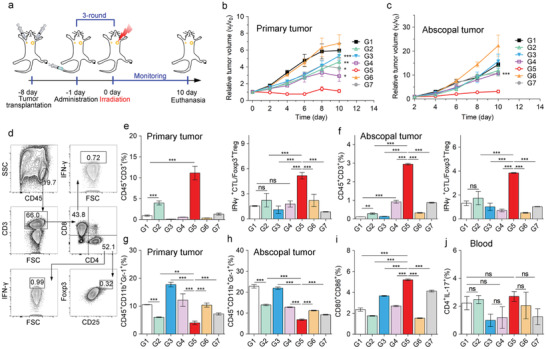
Figure 6.

Antitumor immune responses in bilateral 4T1 tumor model. a) Treatment schedule for Apt/PDGs^s@pMOF‐mediated therapy in bilateral 4T1 tumor model. b) Primary tumor volume change and c) abscopal tumor volume change in BALB/c mice. Data are presented as means ± SD (n = 5). d) Gating strategy to determine frequencies of TILs from tumor lesions. e) CD3+ T cells and CTL/Treg levels in primary tumor lesions and f) abscopal tumor lesions, analyzed by flow cytometry (n = 3). g) MDSCs levels in primary tumor lesions and h) abscopal tumor lesions, analyzed by flow cytometry (n = 3). i) Matured DC levels in TDLN, analyzed by flow cytometry (n = 3). j) Th 17 T cells levels in blood of tumor‐bearing mice, analyzed by flow cytometry (n = 3). G1: Control + L (laser irradiation), G2: Apt/PDs^s@pMOF + L, G3: Apt/PDG@pMOF + L, G4: cApt/PDGs^s@pMOF + L, G5: Apt/PDGs^s@pMOF + L, G6: gemcitabine + L, G7: Apt/PDGs^s@pMOF + D (dark). Significance is defined as ns, no significance, * p < 0.05, ** p < 0.01, *** p < 0.001.
