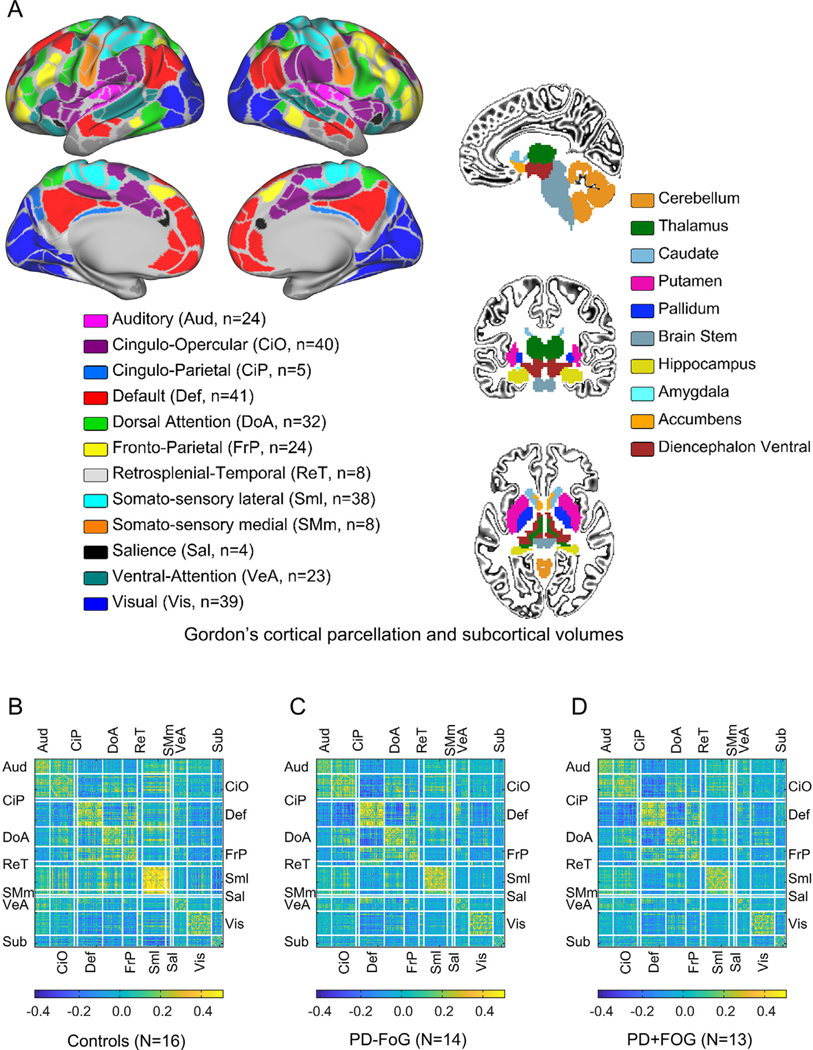
Fig. 1.

Parcellation schema and average connectivity matrices. (A) Gordon’s parcellation schema (Gordon et al., 2014) color-coded by functional system and subcortical volumes from FreeSurfer (Fischl et al., 2002, 2004). Color-coding map also indicates the number of ROIs per network. (B) mean connectivity matrices for the Control (Ct) group. (B) PD non-freezers (PD − FoG). (C) PD freezers (PD + FoG). White lines indicate the borders between functional systems.
