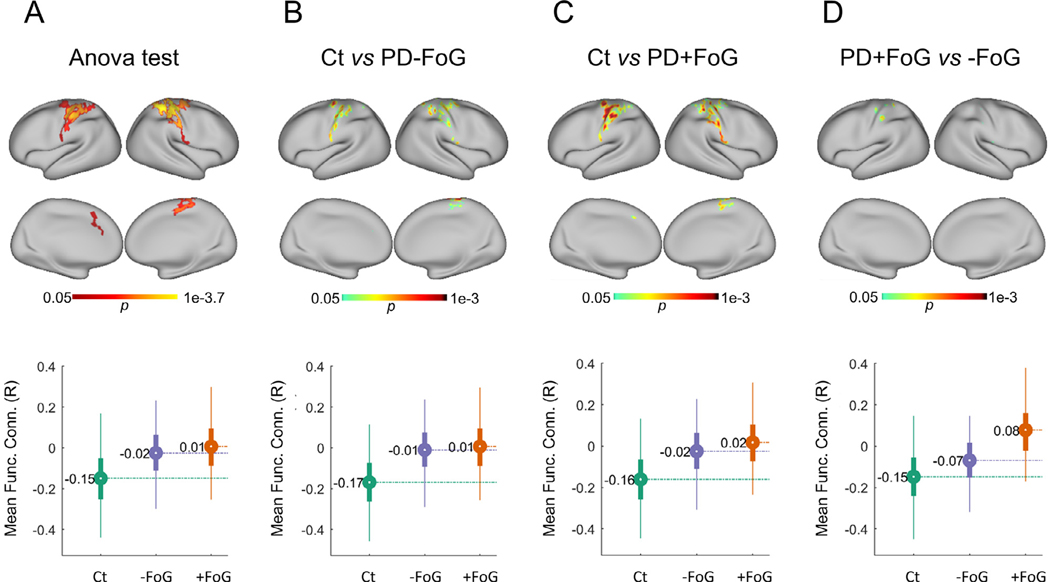
Fig. 3.
Areas with significant differences in functional connectivity from the left globus pallidus. Top panel figures correspond to maps of significant differences in functional connectivity among Ct, PD + FoG and PD − FoG using as seed the left globus pallidus, as revealed by an ANOVA test (A) and posthoc comparisons between Ct and PD − FoG (B), Ct and PD + FoG (C), and PD + FoG and PD − FoG (D). Significant cluster in (D) cover partial sections of the Brodmann areas 1–4. See Fig. 4 for more details. Bottom panel figures show the distribution of functional connectivity between the left-pallidus and the brain areas with significant differences (circles represent the mean functional connectivity and the bar indicates the interquartile range. Thin lines correspond to the percentiles 2.5–97.5).

