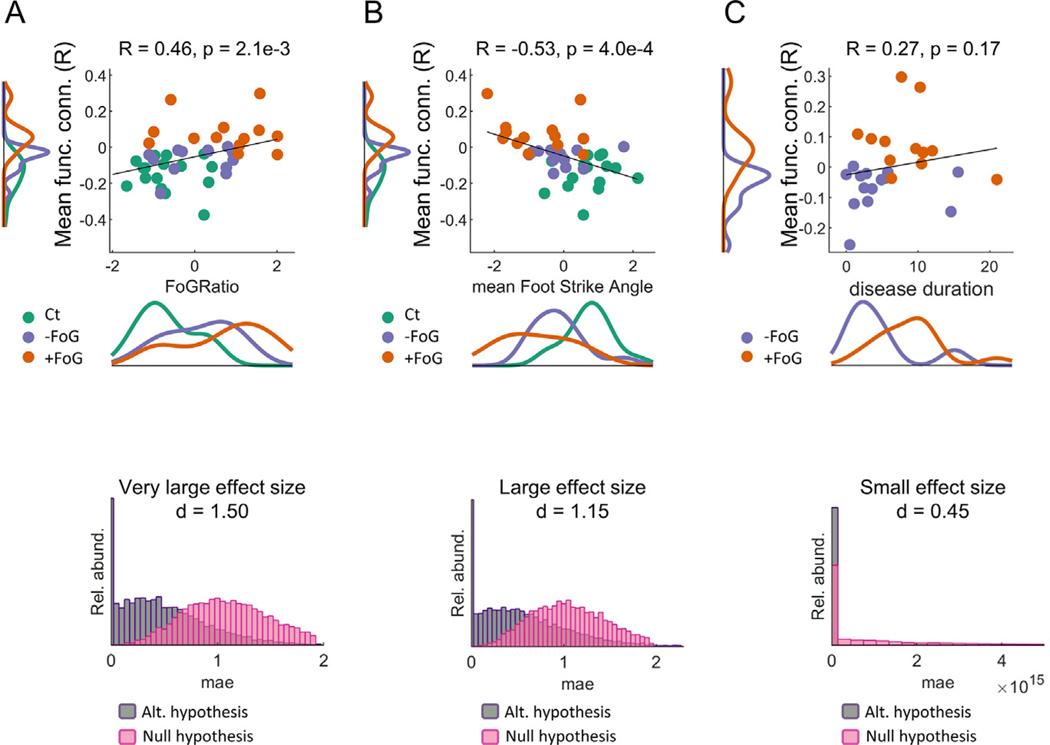
Fig. 5.
Associations between functional connectivity and FoG ratio, strike angle and disease duration. Top panel figures: scatter plots showing the FoG ratio (A), foot strike angle (B), and disease duration (C) versus mean connectivity values between the left globus pallidus and the brain clusters with significant differences between PD + FoG and PD − FoG as a function of FoG ratio, color-coded by diagnosis. Bottom panel figures: distribution of mean absolute errors (mae) when partial least squares models are used to predict out-of-sample values of FoG ratio, foot strike angle, and disease duration. Cohen effect size is also indicated. Notice the low association between imaging and disease duration (C) as accounted by the low correlation and the low accuracy of the models predicting disease duration where the mean absolute errors are of the order of 4e15 years.

