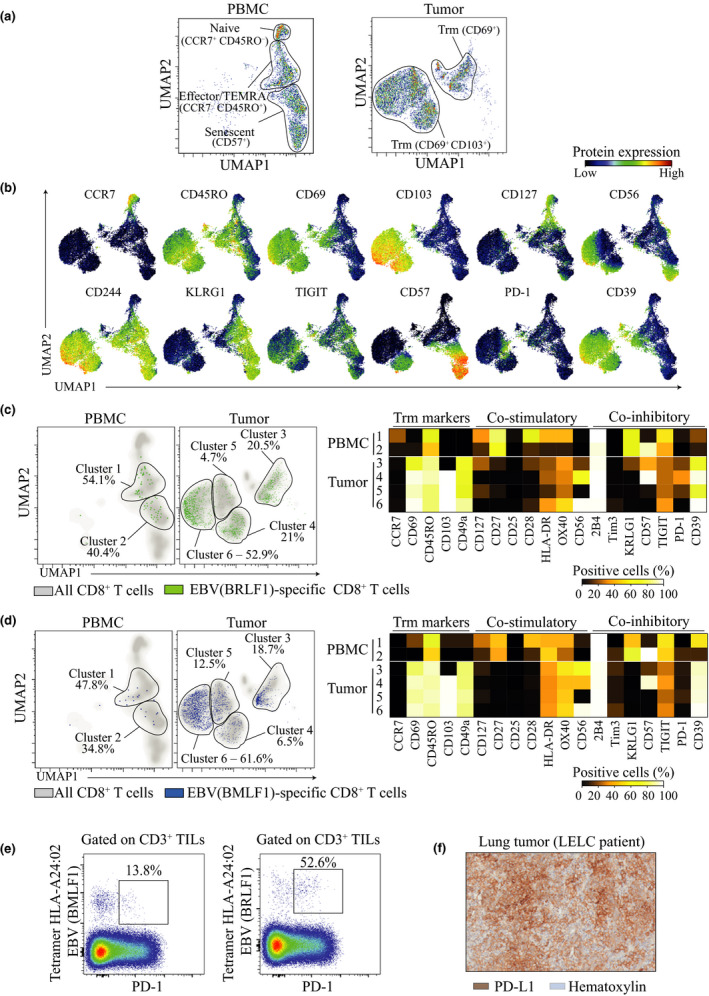
Figure 2.

EBV‐specific CD8+ TILs in EBV‐infected LELC are heterogeneous and partially lack expression of PD‐1. (a) UMAP plots of CD8+ T cells from PBMC (left) and tumor tissue (right) isolated from LELC patient A311 and acquired by mass cytometry. (b) Concatenated peripheral and tumor‐infiltrating CD8+ T‐cell UMAP plot showing expression intensities for various phenotypic surface markers. (c) UMAP plots of EBV (BRLF1)‐specific CD8+ T cells (green) plotted on total CD8+ T cells (grey) in PBMC and tumor from LELC cancer patient (left panel). Based on the clusters identified for BRLF1‐specific CD8+ T cells, frequencies of cells positive for each surface marker were calculated and shown in a heat map (right panel). (d) UMAP plots of EBV (BMLF1)‐specific CD8+ T cells (blue) plotted on total CD8+ T cells (grey) in PBMC and tumor from LELC cancer patient (left panel). Based on the clusters identified for BMLF1‐specific CD8+ T cells, frequencies of cells positive for each surface marker were calculated and shown in a heat map (right panel). (e) Flow‐cytometry staining showing expression of PD‐1 by EBV (BMLF1)‐ and EBV (BRFL1)‐specific CD8+ TILs. Frequencies among tetramer+ CD8+ TILs. (f) Immunohistochemistry staining of the lung tumor from LELC patient stained with haematoxylin (blue) and PD‐L1 (brown) (patient A311).
