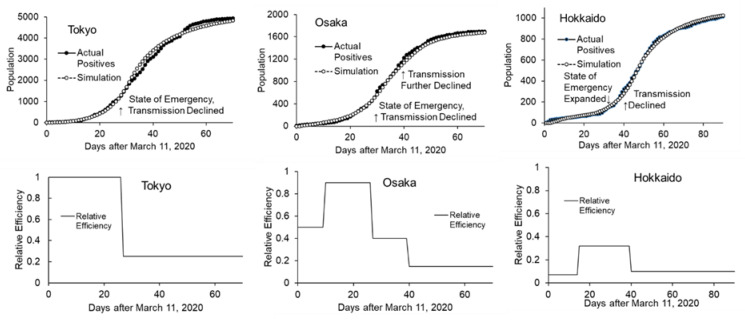
Figure 5.
Actual and simulated confirmed positives in 3 regions (upper) and estimated transmission efficiencies (expressed as relative to efficiency derived from natural reproduction rate, lower) are shown. The periods with maximum transmission efficiency in each region were considered as the baseline of outbreak.

