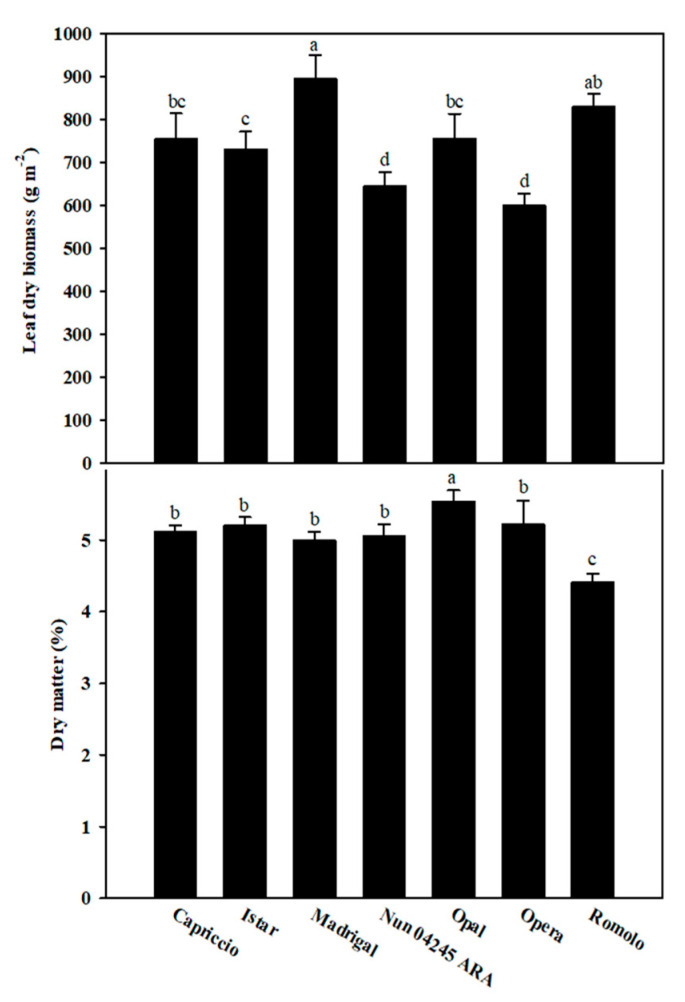
Figure 1.
Leaf dry biomass and leaf dry matter content of seven artichoke cultivars grown in a floating raft culture. Each bar represents the mean ± standard deviation (n = 3). For each bar, different letters indicate statistically different groups (p < 0.05, Duncan’s post-hoc test following ANOVA; n = 3).

