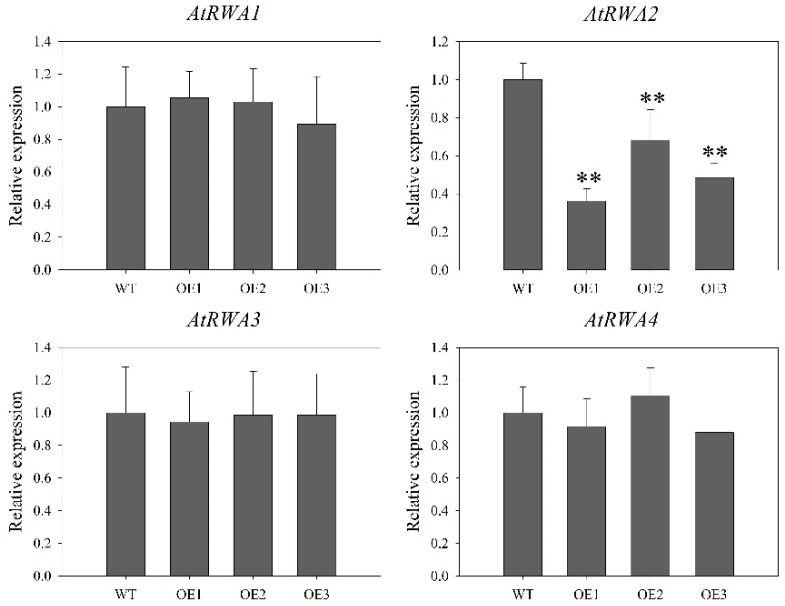
Figure 9.
Relative expression levels of four AtRWA genes in the wild type (WT) and three overexpression (OE) 35S::DoRWA3 transgenic lines (OE1, OE2, OE3). The transcript level of AtRWA genes in the WT was set as 1. Each data bar represents mean ± SD (n = 3). ** indicate p < 0.01 between the transcript levels of three DoRWA genes WT and OE transgenic lines according to DMRT.

