Figure 3.
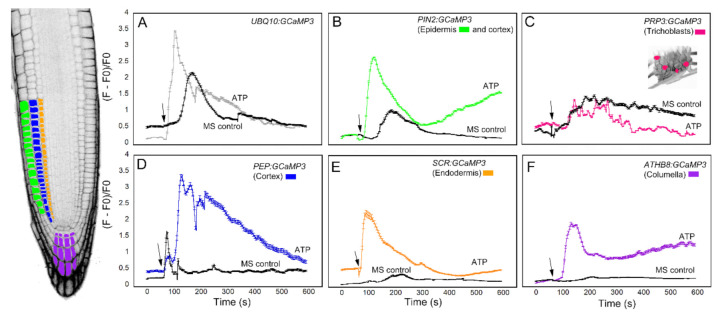
Time course of [Ca2+]cyt changes in A. thaliana roots after 1 mM ATP application. The leftmost panel shows an inverted fluorescence image of the terminal 300 μm of an A. thaliana primary root to illustrate different cells in which GCaMP3 was expressed. Cell types are color coded with green = epidermis; blue = cortex; orange = endodermis; purple = columella; and the pink cells in the inset in panel C = trichoblast. (A–F) Quantification of [Ca2+]cyt -dependent fluorescence of various lines expressing GCaMP3 after ATP and solvent control (0.5× MS) application. Black arrows indicate the time of treatment. Plotted values represent the average normalized fluorescence intensity from 3–6 regions of interest (ROI) per line with standard error bars every fifth time point. Fluorescence values were normalized to the lowest fluorescence value.

