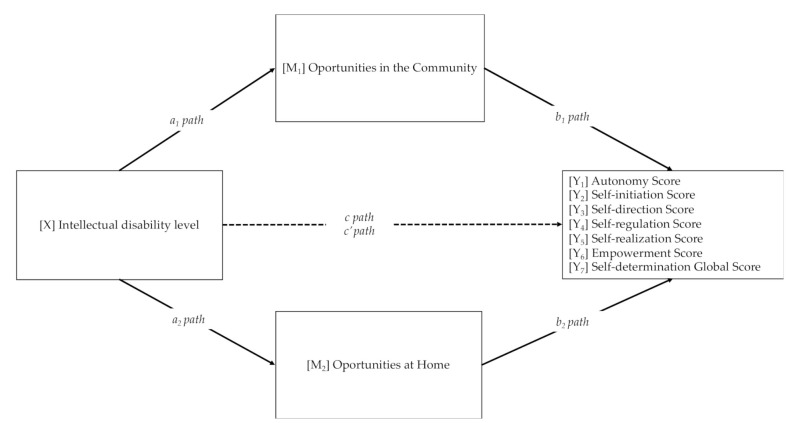
Figure 1.
Conceptual diagram of the mediation analysis. Note: a1 path = effect of X on M1; b1 paths = effect of M1 on Yi; a2 path = effect of X on M2; b2 paths = effect of M2 on Yi; c paths = total effect of X on Yi; and c′ paths = direct effect of X on Yi controlling for M. Seven separate paths were conducted (Y1–4) with the predictor (X).

