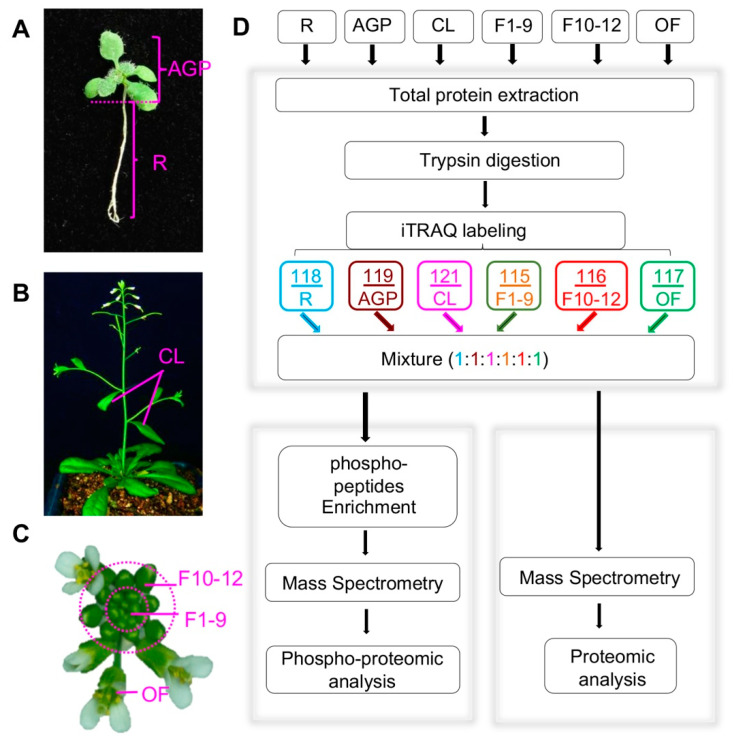
Figure 1.
Plant tissue collection and the procedure for quantitative proteomics and phospho-proteomics analyses. (A) Above-ground parts (AGP) and roots (R) of 16-day-old plants. (B) Front view of plants during the flowering period, including cauline leaves (CL) and inflorescences (Flower). (C) Col-0 inflorescence including stage 1–9 flowers (F1–9), stage 10–12 flowers (F10–12), and open flowers (OF). (D) Workflow of our iTRAQ-based quantitative proteomics and phospho-proteomics analyses. The arrows represent experiment process.

