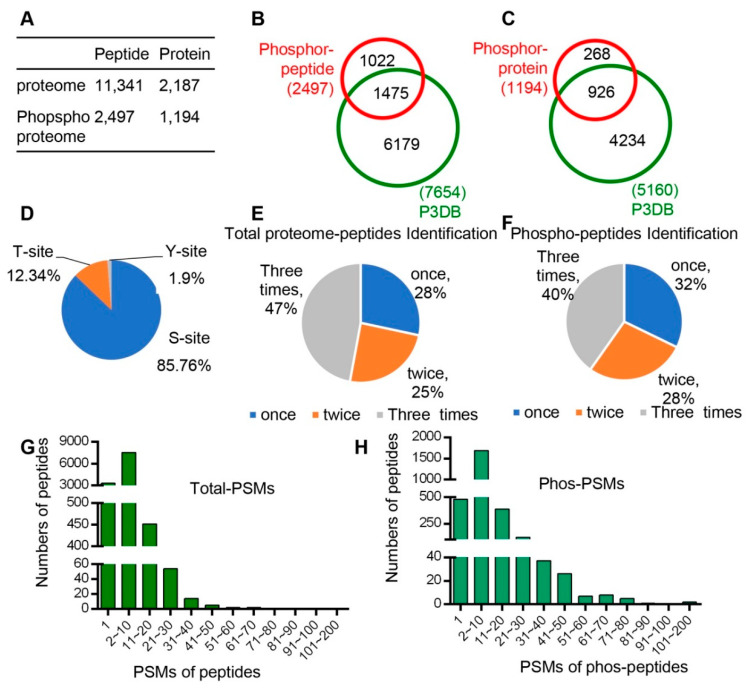
Figure 2.
All peptide and phsophopeptide data were summarized and compared with database data. (A) Number of peptides and unique proteins that we identified from proteomes and phospho-proteomes. (B) Comparison of phospho-pepitides and the P3DB database (the Plant Protein Phosphorylation Database, http://www.p3db.org). (C) Comparison of phospho-proteins and the P3DB database. (D) Distribution of phosphorylated amino acids (S, T, Y) in the phospho-proteome. (E) Distribution of times of identification in total proteome peptides. (F) Distribution of times of identification in phospho-peptides. (G) Distribution of Peptide-Spectrum Matches (PSMs) in total proteome peptides. (H) Distribution of Peptide-Spectrum Matches (PSMs) in phospho-peptides.

