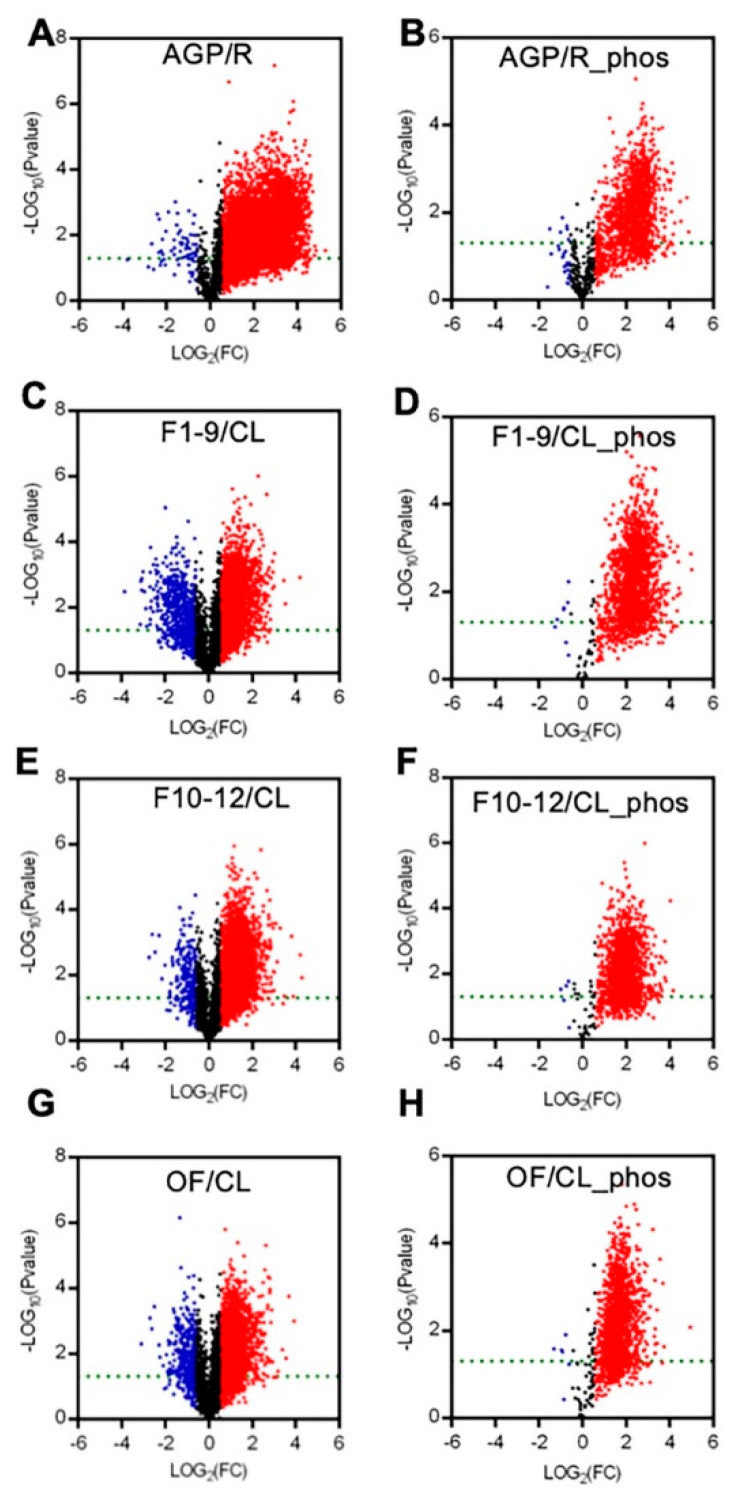
Figure 3.
Summary of the expression levels of differences between AGP and R, F1–9 and CL, F10–12 and CL, OF and CL in quantitative peptides and phosphopeptides. (A) Volcano plot between R and AGP peptide samples. (B) Volcano plot between R and AGP phosphopeptide samples. (C) Volcano plot between F1–9 and CL peptide samples. (D) Volcano plot between F1–9 and CL phosphopeptide samples. (E) Volcano plot between F10–12 and CL peptide samples. (F) Volcano plot between F10–12 and CL phosphopeptide samples. (G) Volcano plot between OF and CL phosphopeptide samples. (H) Volcano plot between OF and CL phosphopeptide samples. R, 14-day-old root; AGP, 14-day-old tissues above ground part; CL, cauline leaves; F1–9, stage 1–9 flowers; F10–12, stage 10–12 flowers; OF, opened flowers. The red denotes log2FC > 1 and p-value < 0.05. The blue denotes log2FC < −1 and p-value < 0.05. The black denotes −1 < log2FC < 1 or p-value > 0.05.

