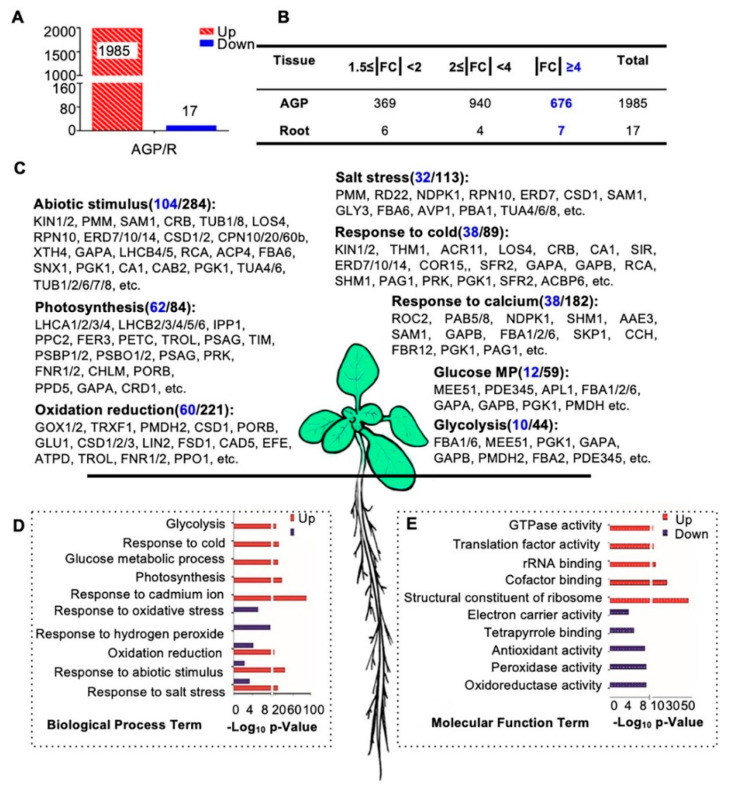
Figure 4.
Biological process and molecular function enrichment analysis of AGP-root differentially expressed proteins. (A) Numbers of differentially expressed proteins in the comparison of above-ground parts (AGP) and roots in 16-day-old plants: 1985 proteins up-regulated and 17 proteins were downregulated in aboveground parts. (B) Detailed distribution of differentially expressed proteins. The highlighted number denotes numbers of protein with |FC| ≥ 4. (C) Biological process enrichment of upregulated proteins in the AGP. The highlighted number denotes numbers of protein with |FC| ≥ 4. (D) Biological process enrichment of differentially expressed proteins in AGP. (E) Molecular function enrichment of differentially expressed proteins in the aboveground parts. Counts in blue indicate the number of proteins with fold changes greater than four. The p-value is the enrichment score (E-score) from DAVID (http://david.abcc.ncifcrf.gov/). Higher-log10 p-values indicate more significant enrichment.

