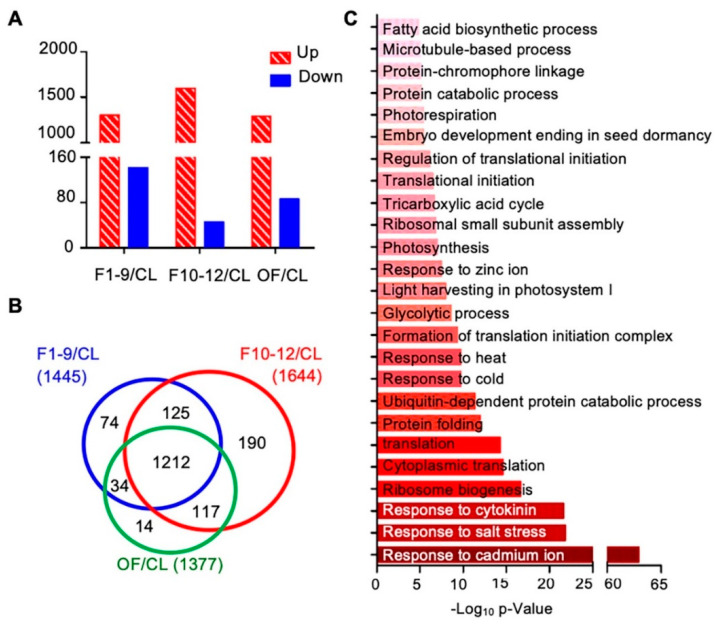
Figure 6.
Flower-leaf differentially expressed proteins and their potential involvement in functional processes. (A) Numbers of upregulated and downregulated proteins in F1–9/CL, F10–12/CL, and OF/CL. (B) Venn diagram of the numbers of differentially expressed proteins in comparisons of stage 1–9 flowers/CL, stage 10–12 flowers/CL, and open flowers/CL. (C) Biological process enrichment of the overlapping 1212 proteins that who showed significant expression levels in all three floral stages. The p-value is the enrichment score (E-score) from DAVID. Higher −log10p-values indicate more significant enrichment. The dark and light red denote the higher and lower degree of GO enrichment respectively.

