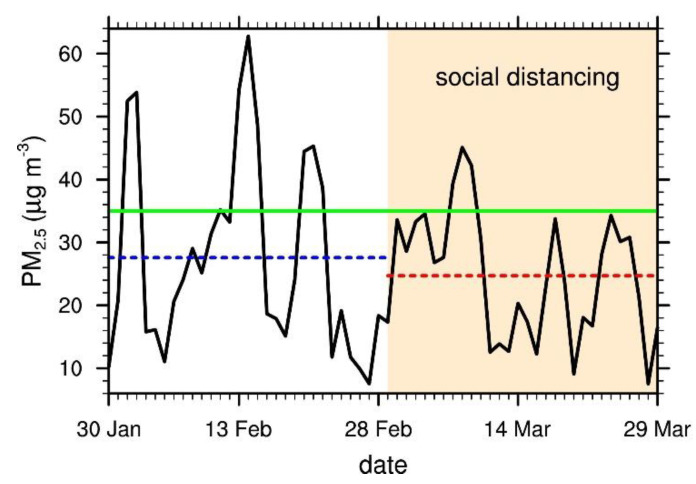
Figure 3.
Time series of the daily mean PM2.5 concentration during pre-SD and SD in 2020. The horizontal dashed lines indicate the 30 day mean values for pre-SD (blue) and SD (red), respectively. The green horizontal solid line marks the threshold level of PM2.5 concentration (35.0 μg m−3, “high” if >35.0 μg m−3). The period of social distancing (SD) is indicated by the shaded area.

