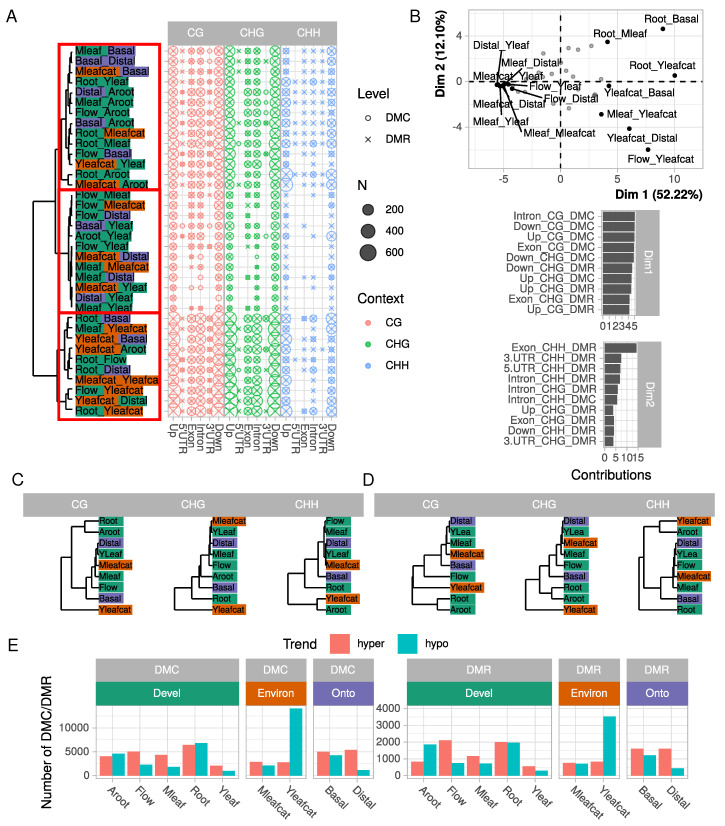
Figure 2.
Classification of samples according to DMC and DMR numbers and contexts. (A) number of DMC and DMR in all 36 pairwise comparisons, for each context and gene model feature. Comparisons were clustered using an Euclidean distance calculated on the number of DMCs/DMRs and the Ward agglomeration criterion. (B) principal component analysis of DMC/DMR number. Comparisons are projected on the two first dimensions but names are indicated only for the 15 highest contributions. For both dimensions, the five highest variable contributions are represented below. (C,D) samples clustered according to the numbers of DMC and DMR, respectively. Euclidean distances were calculated on square matrices containing samples in rows and columns. Clustering was constructed according to Ward agglomeration criterion; (E) number of hyper- and hypo-methylated DMCs/DMRs for each sample compared with all eight others.

