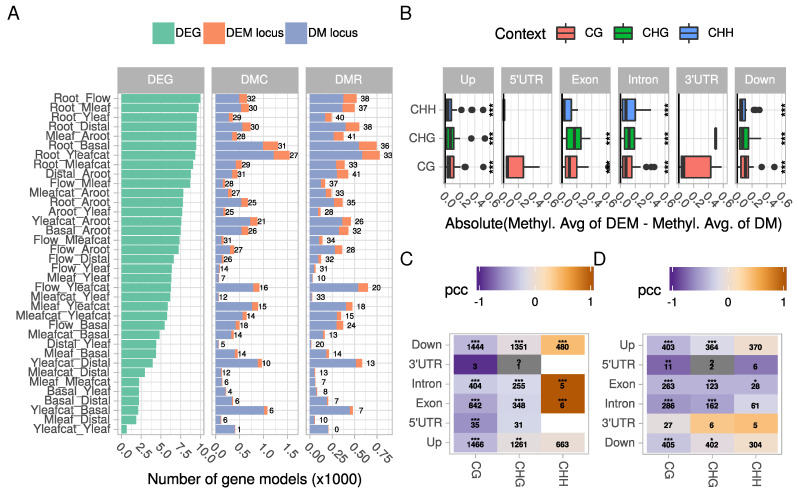
Figure 3.
Relationship between differential methylation and differential expression. (A) number of differentially expressed genes (DEG), and number of gene models harboring at least one DMC or one DMR. A DM (differentially methylated) locus corresponds to a non-DEG with at least one DMC or DMR, while a DEM (differentially expressed and methylated) locus corresponds to a DEG with at least one DMC or DMR. Numbers correspond to the % of DEM/DM. Please note the differences in scale on the x-axis; (B) methylation differences of DEM or DM genes were averaged per comparison, context and gene feature. Differences between averages were calculated to highlight variation in methylation profiles between DEM and DM genes. The boxplots summarize data from all comparisons using absolute values of average differences. Asterisks denote statistical significant differences (Wilcoxon rank sum test, Bonferroni corrected p-values, ***: p < 0.001). (C,D) Pearson correlation coefficients (PCC) measuring the correlation between a gene expression log2FC and its methylation state (“.” p < 0.1, “*” p < 0.05, “**” p < 0.01, “***” p < 0.001) at the DMC and DMR levels, respectively. Numbers in cells correspond to the number of points used to calculate correlations.

