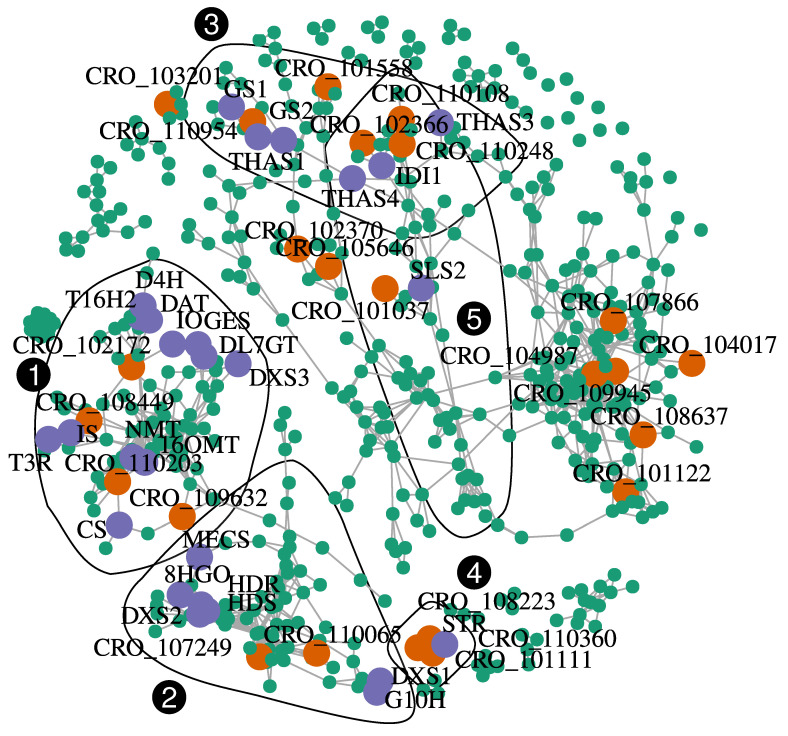
Figure 6.
Co-expression network (Spearman’s rho correlation-based) visualizing transcriptional relationships among MIA genes and other differentially methylated and expressed genes detected in this study. MIA genes are indicated by purple points and black labels, while differentially expressed and methylated genes are indicated in turquoise or orange if they code potential transcription factors (Table 1). Genes are connected by grey segments if their Spearman’s rho coefficient was above 0.95. Black polygons correspond to communities detected with a fast greedy modularity optimization based algorithm. Only communities containing at least one MIA gene are shown. Numbers in white in black circles correspond to community identification numbers.

