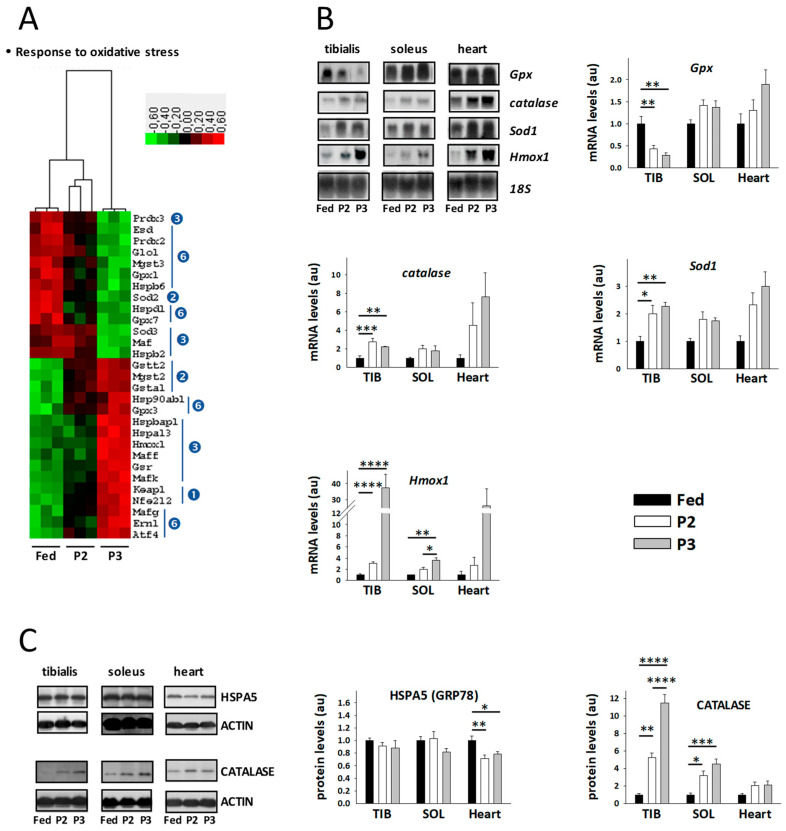
Figure 6.
Changes related to oxidative stress in tibialis anterior muscle of rats during prolonged fasting. (A) Heatmaps showing differentially abundant transcripts between fed, phase 2 (P2), and phase 3 (P3) animals (N = 3/group). Red, black, and green boxes represent downregulated, intermediate, and upregulated genes, respectively. Legend for numbers in blue circles, which indicate when mRNA levels were significantly changed (ANOVA and Tukey p-values < 0.001), is given in Figure 2B. (B) Representative Northern blots and densitometry data for muscle mRNAs (means ± SEM, N = 5/group). (C) Representative Western blots and densitometry data for muscle proteins (means ± SEM, N = 5/group). The values in fasted animals were normalized to those in fed rats that were assigned an arbitrary value of 1. * p-values < 0.05, ** p-values < 0.01, *** p-values < 0.001, **** p-values < 0.0001 (one-way ANOVA and Tukey tests). Sod1: superoxide dismutase 1; Gpx: glutathione peroxidase; Cat: catalase; Hmox1: heme oxygenase 1; HSPA5 (GRP78): ER chaperone BiP; au: arbitrary units.

