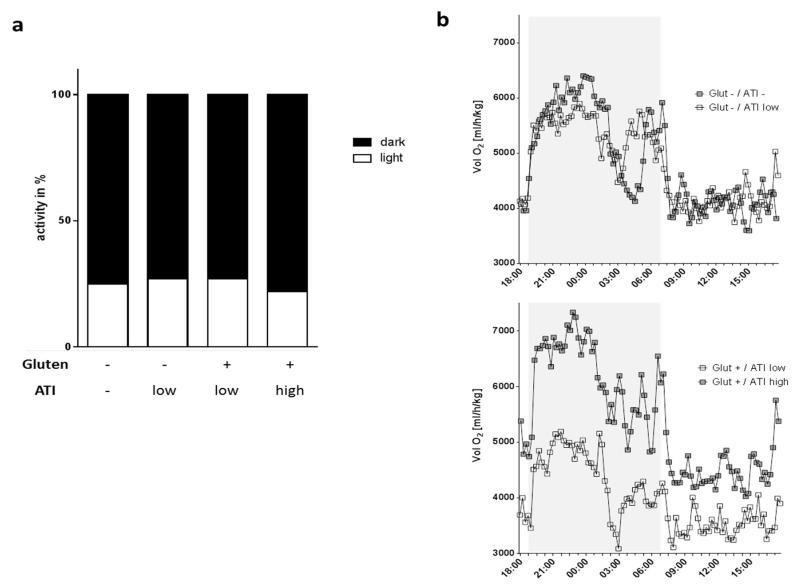
Figure 2.
Activity and metabolic capacity of 5xFAD mice under the 4 different diets. (a) Locomotive activity during dark and light phase was assessed by light-beam sensors. (b) Oxygen consumption. Mice were placed in metabolic cages for 48 h and one cycle of measurement including 24 h was used for analysis (n ≥ 7 per group). The dark phase is indicated by a grey box. Shown are means per time point; SEMs and p-values of multiple t-test comparison are not shown for clearness of the graphs (p-values are given in Table S2).

