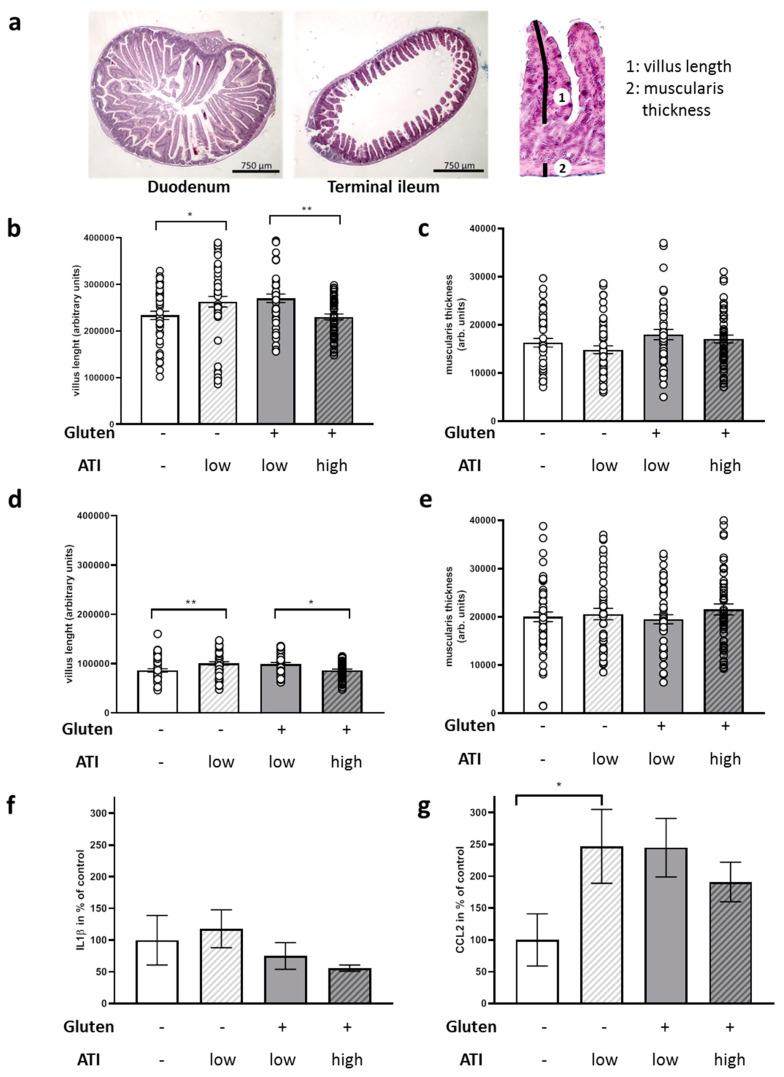
Figure 3.
Micromorphological measurements and quantitation of inflammatory markers in the small intestine of 5xFAD mice fed with ATI-deficient or ATI-supplemented diet. Tissue specimens were drop-fixed and subsequently two slices per tissue sample and animal were used for HE staining. Length of two villi and the thickness of the underneath located muscularis were measured per slide. (a) Exemplary pictures of duodenum and terminal ileum. For an example of measures of villus length (1) or muscularis thickness (2), see the magnified segment of the terminal ileum on the right. (b) Relative measures of duodenal villi. (c) Thickness of muscularis from duodenum. (d) Villus length within terminal ileum sections. (e) Muscularis thickness within terminal ileum sections. All data are given as mean ± SEM. Statistical analysis was performed by One Way ANOVA (Sidak’s multiple comparisons test; *, p < 0.05; **, p < 0.01; n = 7 animals per group). (f) Interleukin 1 β (IL1β) and (g) C–C motif chemokine ligand 2 (CCL2) mRNA levels of terminal ileum were quantified by qPCR and normalized to beta actin mRNA levels. Data present mean ± SEM. Statistical analysis was performed by One Way ANOVA (Uncorrected Fisher’s LSD test; *, p < 0.05; n = 4–8 animals per group).

