Figure 6.
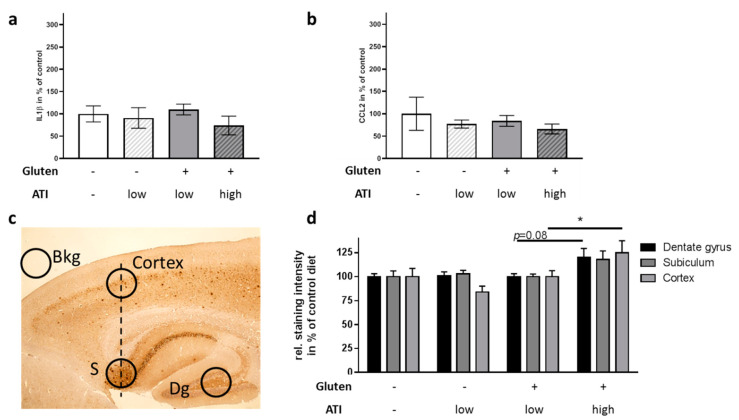
Inflammatory markers and plaque deposition in the brain of 5xFAD mice ingesting different levels of ATIs. (a) IL1β and (b) CCL2 mRNA levels were quantified by qPCR and normalized to beta actin mRNA levels. Data present means ± SEM. Statistical analysis was performed by One Way ANOVA (n = 4–6 animals per group). (c) Positioning of densitometric analysis areas on the brain slides (S: Subiculum; Dg: Dentate gyrus). Exemplarily, a slide derived from a mouse fed with gluten- and ATI-free diet is shown. (d) Quantitative analysis of Aβ-containing depositions. Measurements have been corrected for background (Bkg) and are presented as staining relative to area in % of gluten-free/ATI-free diet. Two slides per animal were analyzed (n = 5–8). All data are given as mean + SEM. Statistical analysis was performed by One Way ANOVA (*, p < 0.05).

